
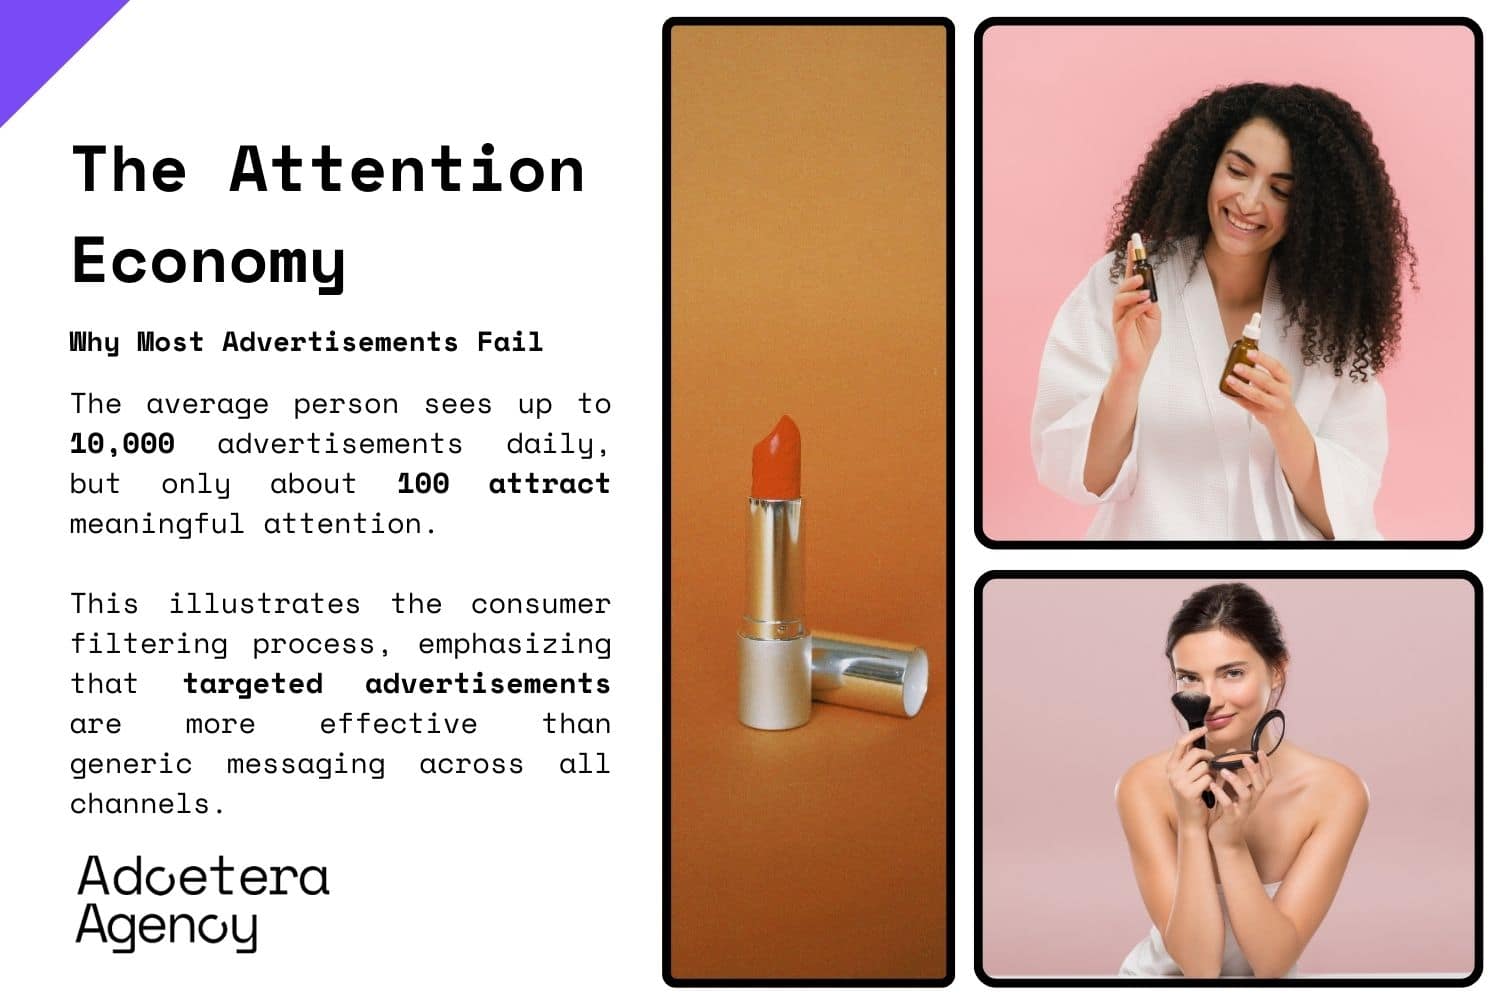
Studies show that the average person encounters between 4,000 and 10,000 advertisements daily, yet barely 100 receive any meaningful attention. In this overcrowded landscape, creating an advertisement that not only catches the eye but also persuades viewers to take action requires both artistic finesse and scientific precision.
Nielsen’s Global Trust in Advertising report reveals a compelling insight: 83% of consumers take action after seeing an advertisement they trust. Despite this potential, the sobering reality is that the average conversion rate across industries hovers around just 3.2%. This gap between potential and reality underscores why most businesses struggle with their advertising efforts.
Whether you’re crafting a powerful brand advertisement or launching a targeted digital campaign, the principles that drive conversions remain consistent. This comprehensive guide walks you through the proven process of creating an advertisement that transforms casual viewers into committed customers maximizing both your impact and return on investment.
1. Understanding Your Audience Before Creating an Advertisement
The foundation of any high-converting advertisement begins with deep knowledge of your target audience. According to recent Salesforce research, two-thirds of customers (66%) expect companies to understand their unique needs and expectations before they engage.
1.1 Audience Research Methodologies That Drive Conversions
When planning how to make an advertisement that resonates, start by gathering meaningful data about your audience. Quantitative analysis through platforms like Google Analytics reveals that advertisements aligned with specific user interests perform 45% better on conversion metrics compared to generic appeals. This insight explains why social media advertisement campaigns targeting precise audience segments consistently outperform broader approaches.
Qualitative research provides equally valuable insights. Companies that incorporate direct customer feedback into their advertisement creation process see an average 18% boost in conversion rates. This explains why brands increasingly use customer interviews to identify pain points before crafting their messaging.
Social listening has emerged as another critical tool. According to Sprout Social, brands that monitor conversations around their industry when creating advertisements improve their relevance scores by nearly a third (31%). This approach proves especially effective for Instagram advertisement campaigns, where cultural relevance significantly impacts engagement.
1.2 Building Conversion-Focused Audience Personas
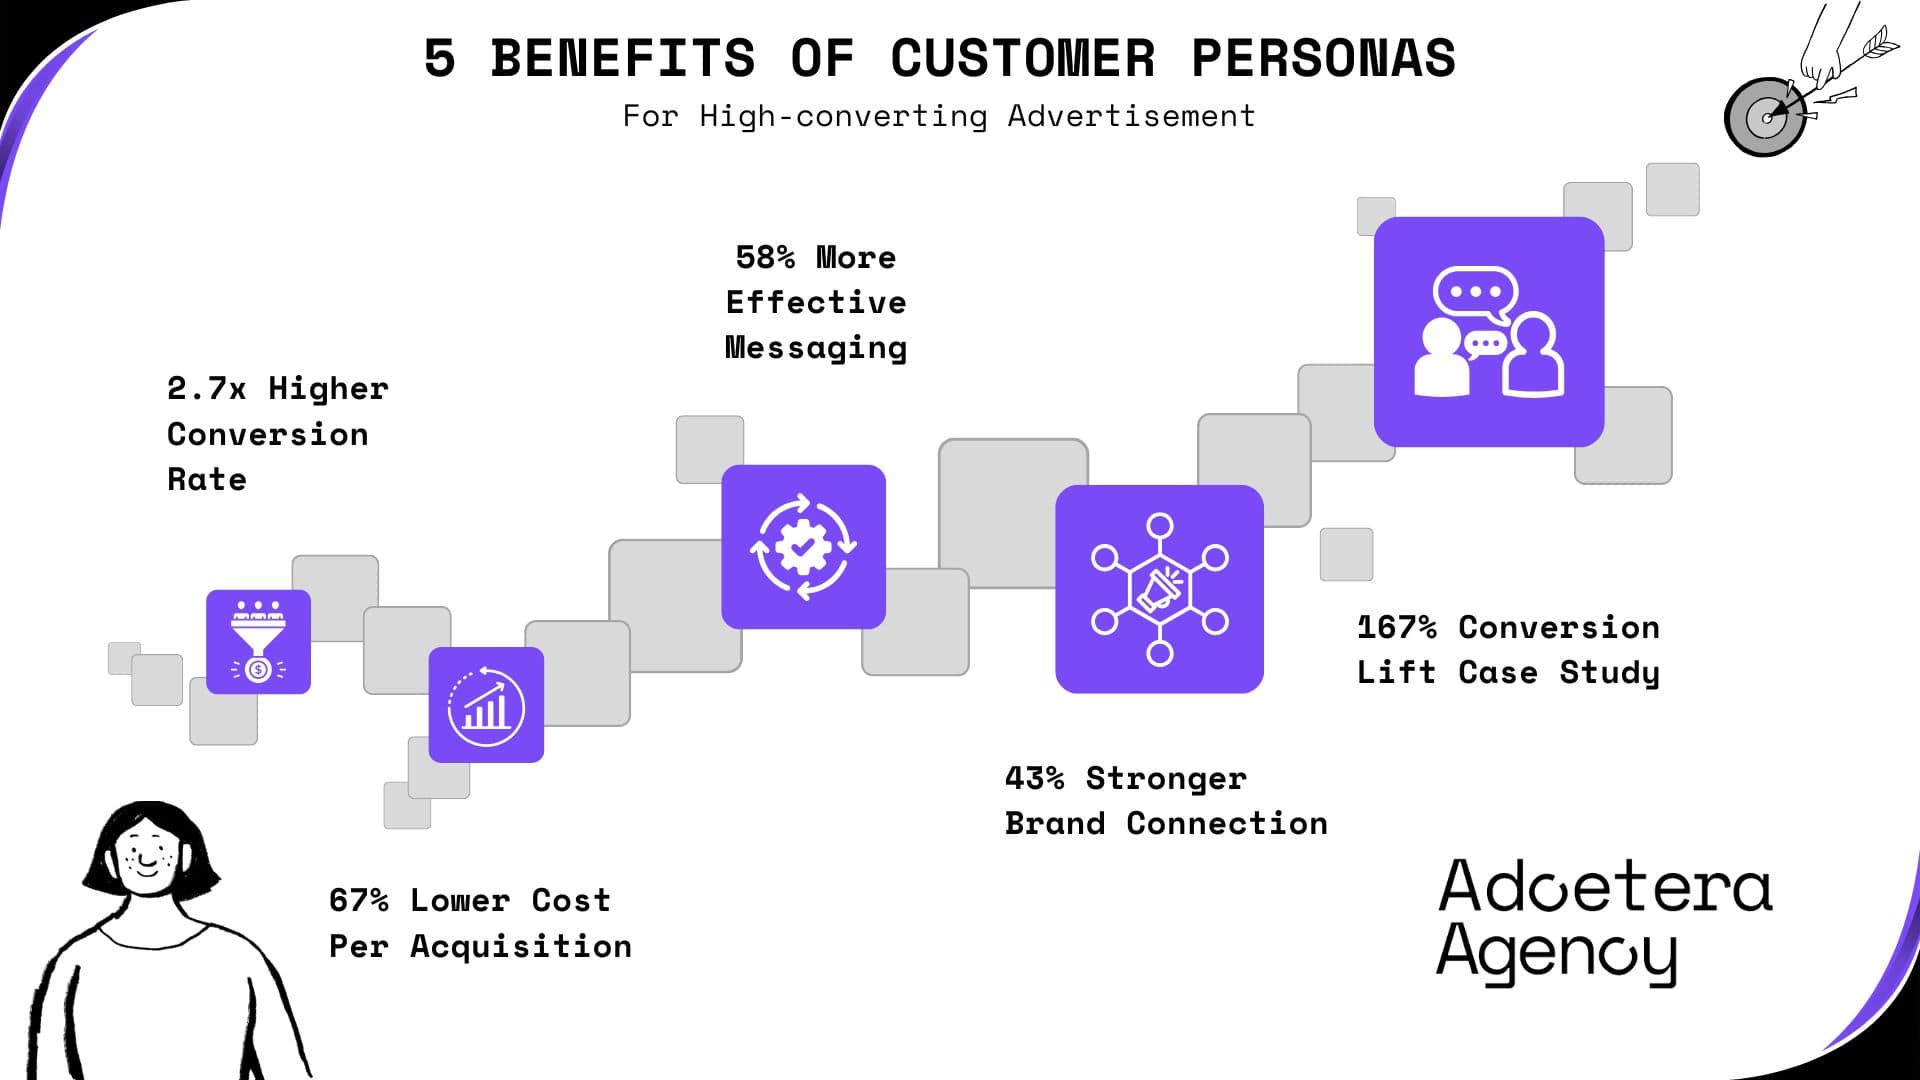
Microsoft’s extensive research indicates that advertisements targeted to specific personas convert at 2.7 times the rate of generic messaging. When developing these personas, focusing on behavioral patterns rather than demographics alone yields the strongest results.
Identifying specific decision triggers (what exactly prompts your audience to convert) provides the cornerstone for effective messaging. These triggers vary widely: some audiences respond to urgency, others to authority signals, and still others to exclusivity.
Understanding where potential customers sit in their buying journey also dramatically impacts conversion rates. One retail brand achieved a remarkable 167% increase in conversions by creating six distinct personas and crafting advertisements that addressed each persona’s specific objections to purchase a strategy that works particularly well for product advertisement campaigns.
Summary – Understanding Your Audience:
| Research Methodology | Impact on Conversion | Key Finding |
| Quantitative Analysis | +45% | Advertisements aligned with user interests perform significantly better |
| Qualitative Research | +18% | Customer feedback integration boosts conversion rates |
| Social Listening | +31% | Improved relevance scores for brands monitoring industry conversations |
| Persona-Based Targeting | +270% | Advertisements targeted to specific personas convert at 2.7x the rate of generic messaging |
2. Setting Clear Objectives for Your Advertisement
Before determining how to make an advertisement, establishing precise goals is essential. LinkedIn’s Marketing Solutions research confirms that campaigns with clearly defined objectives deliver 30% higher ROI than those with vague intentions.
2.1 The SMART Framework for Advertisement Goals
High-converting advertisements follow the SMART methodology for goal-setting. This means creating objectives that are Specific about exactly what conversion means for your particular campaign, whether that’s generating leads, driving sales, or encouraging app downloads.
Your goals must be Measurable through concrete metrics like conversion rate, cost per acquisition, or return on ad spend. They should be Achievable based on industry benchmarks and your historical performance while remaining Relevant to your broader business goals. Finally, they need to be Time-bound with a definitive timeline for measuring success.
A SaaS company applying this framework to their advertising objectives saw a 43% increase in qualified leads simply by focusing specifically on demo requests rather than general engagement; demonstrating how clarity of purpose drives results.
2.2 Aligning Ad Objectives with Business Goals
Content Marketing Institute research reveals that advertisements aligned with specific business objectives convert at rates 2.2 times higher than those focused solely on creative execution. This alignment takes different forms depending on where your audience sits in the purchase journey.
For awareness goals, 32% of brands successfully used advertisements to increase brand recognition within new market segments. When targeting consumers in the consideration phase, product demonstration advertisements increased purchase intent by 85% for considered purchases.
And for driving immediate action, direct response advertisements with clear calls-to-action produced 79% higher conversion rates than image-focused branding ads; a principle that applies whether creating a Facebook advertisement or traditional media buy.
Summary – Setting Clear Objectives:
| Objective Type | ROI Impact | Example Success Metric |
| SMART Framework Implementation | +30% higher ROI | SaaS company increased qualified leads by 43% |
| Awareness Goals | +32% | Increase in brand recognition within new market segments |
| Consideration Goals | +85% | Increased purchase intent through product demonstrations |
| Conversion Goals | +79% | Higher conversion rates with clear CTAs vs. image-focused ads |
3. Market and Competitor Analysis
Understanding your competitive landscape dramatically impacts how to make an advertisement that stands out. HubSpot research found that 69% of high-performing campaigns conducted thorough competitor analysis before creative development.
3.1 Competitive Intelligence Gathering
Before creating your advertisement, analyzing competitor messaging provides critical insights. By documenting the primary value propositions, tone, and creative approaches used by competitors, you establish a baseline for differentiation.
Identifying channel strategies (determining where competitors place their advertisements and their approximate spend) helps avoid market blindspots. Tools like SpyFu provide estimated budget allocations that reveal where competitors focus their resources.
Evaluating performance through social engagement metrics and estimated click data helps assess which competitor advertisements perform best.
Companies conducting this type of comprehensive competitive analysis before campaign launches experienced 23% higher conversion rates and 18% lower cost per acquisition than those skipping this step.
3.2 Positioning Your Advertisement for Maximum Conversion
Data from MarketingSherpa indicates that advertisements highlighting unique differentiators convert 58% better than those focused on common industry features. This principle applies whether creating a sophisticated television advertisement or a targeted digital campaign.
Effective positioning starts with identifying market gaps and finding unfulfilled needs or underserved segments where your offering provides unique advantages.
Creating contrast by directly addressing how your solution differs from alternatives proves especially effective for B2B advertisements, with 41% of high-converting campaigns explicitly mentioning competitive advantages.
When possible, positioning as a category creator rather than a participant delivers outsized returns. Research shows category creators capture 76% of the market share on average, explaining why innovative logos advertisement approaches that establish new visual territory often outperform incremental improvements.
Summary – Market and Competitor Analysis:
| Analysis Method | Performance Impact | Implementation Example |
| Competitor Messaging Analysis | +58% conversion | Advertisements highlighting unique differentiators outperform common features |
| Comprehensive Competitive Analysis | -18% CPA | Lower cost per acquisition for companies conducting thorough analysis |
| Category Creation | 76% market share | Average capture rate for category creators versus participants |
| Pre-Launch Competitor Research | +23% conversion | Conversion improvement for campaigns with thorough competitor analysis |
4. Crafting a Compelling Message That Converts
The message itself remains paramount when determining how to make an advertisement successful. Conversion Sciences found that copy changes alone can increase conversion rates by up to 113% more than any design element.
4.1 Psychology of High-Converting Ad Copy
Research from behavioral science labs demonstrates several principles that consistently drive advertisement effectiveness. Understanding these behavioural science advertising principles provides a significant competitive advantage.
Loss aversion represents one of the most powerful forces in decision-making. Advertisements highlighting potential losses convert 2.7 times better than those focusing on gains; explaining why “don’t miss out” messaging consistently outperforms “gain this benefit” framing.
Social proof similarly drives action. Including specific statistics on user adoption increased conversion rates by 58% in tested campaigns. This explains why testimonials and user counts feature prominently in high-converting advertisements.
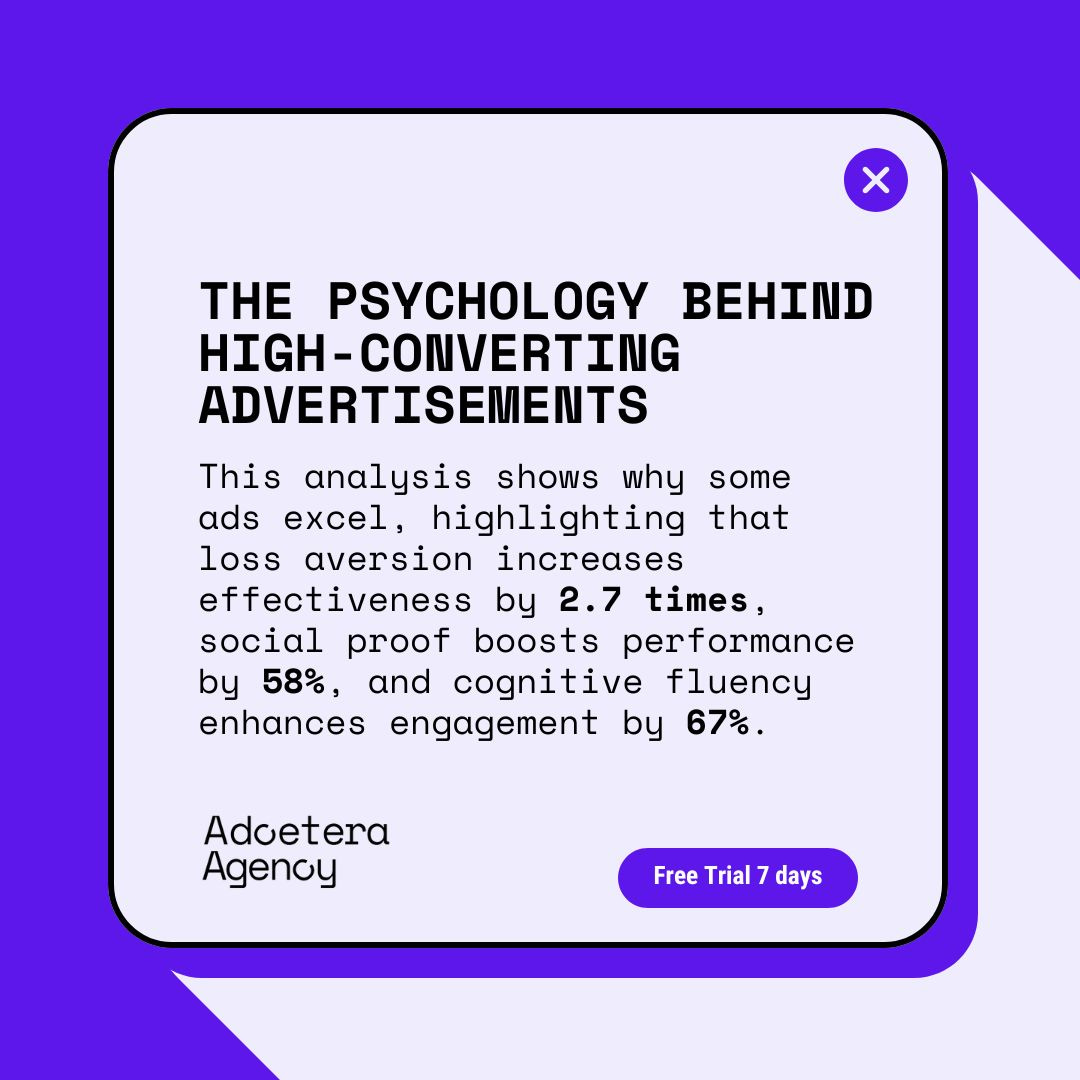
Cognitive fluency (how easily viewers can process your message) also significantly impacts conversion. Advertisements with readability scores matching their target audience converted 67% more often than those written above or below audience comprehension levels. This principle explains why the most effective book advertisement campaigns use language tailored to their specific reader demographic.
4.2 Structuring Your Value Proposition
Harvard Business Review research shows that advertisements with clearly articulated value propositions outperform those without by 124%. An effective structure begins by explicitly stating the challenge your audience faces, which increases relevance by 37%.
Next comes a concise solution presentation; keeping this under 15 words improves comprehension by 38%. Following with benefit articulation that focuses on outcomes rather than features improves conversion rates by a third (33%). Adding proof elements like testimonials can further increase conversion rates by 34%.
One financial services firm implemented this structured approach and saw form completion rates more than triple, jumping from 3.2% to 9.7%. This dramatic improvement demonstrates the power of structured messaging in driving advertising performance.
Summary – Crafting Compelling Messages:
| Messaging Element | Conversion Impact | Research Source |
| Loss Aversion Framing | +270% | Behavioral design labs |
| Social Proof Elements | +58% | Conversion rate increase with specific adoption statistics |
| Cognitive Fluency Match | +67% | Higher conversions when readability matches audience level |
| Clear Value Proposition | +124% | Harvard Business Review research on messaging structure |
5. Visual Design Elements That Drive Conversions
When exploring how to make an advertisement that converts, visual elements remain crucial. Eye-tracking studies show that viewers form first impressions in just 50 milliseconds, with 94% of these impressions based on design elements rather than copy.
5.1 Data-Driven Design Decisions
Research from conversion optimization firms reveals several visual best practices with significant impact. Color psychology plays a major role, with red CTAs outperforming green by 21% in direct response advertisements, while blue backgrounds increased trust perception by 34%.
Visual hierarchy (how the eye moves through your advertisement) directly impacts engagement. Advertisements with clear visual flow (following F or Z patterns) had 38% higher interaction rates than those with scattered focal points.
White space utilization improves focus on key elements. Increasing white space around CTAs improved click-through rates by 20% in tested campaigns. And image selection significantly impacts emotional response, with human faces increasing engagement by 38%, while product-in-use images lifted conversion rates by 27% compared to product-only visuals.
5.2 Device-Specific Visual Optimization
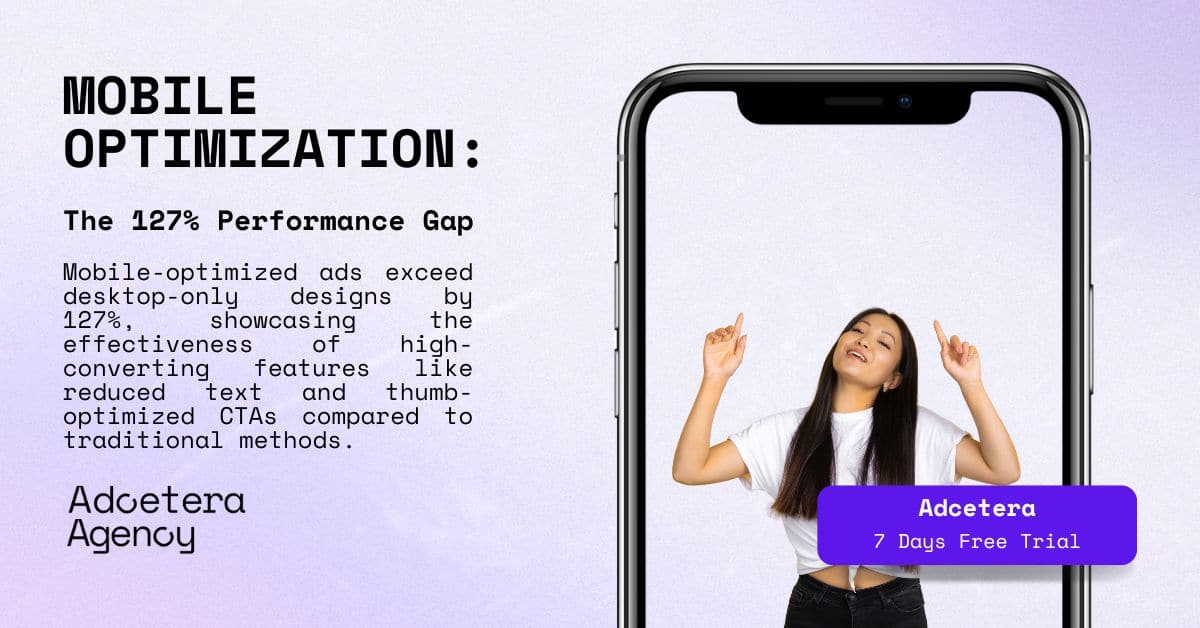
Mobile-optimized advertisements now outperform desktop-only designs by 127%, reflecting changing consumption patterns. This disparity makes mobile optimization essential for contemporary advertising success.
Text size and density require special attention, with mobile advertisements featuring 50% less text than desktop versions converting 64% better. Touch-optimized elements designed for thumb interaction (minimum 44×44 pixels) improved mobile conversion rates by 19%. And load speed optimization delivers consistent benefits, with every second of load time reduction increasing conversion rates by 7% on average.
Summary – Visual Design Elements:
| Design Element | Performance Impact | Testing Methodology |
| CTA Color (Red vs. Green) | +21% | Direct response A/B testing |
| Visual Flow Patterns (F or Z) | +38% | Higher interaction rates through eye-tracking studies |
| White Space Around CTAs | +20% | Improved click-through rates in controlled tests |
| Mobile Text Reduction | +64% | Higher conversion with 50% less text than desktop versions |
These principles of behavioral science marketing demonstrate why seemingly small visual changes can deliver outsized conversion improvements.
6. Selecting the Right Advertising Channels
Channel selection significantly impacts how to make an advertisement effective. McKinsey research shows that optimizing channel mix can improve ROAS by 15-30% with no additional spending making this a high-leverage decision area.
6.1 Channel Effectiveness by Industry
Data reveals significant performance variations across sectors. For e-commerce businesses, Instagram Shopping advertisements on mobile devices achieve an average 3.8% conversion rate compared to the industry benchmark of 2.5%.
B2B services find their highest performance through LinkedIn Sponsored Content, reaching 2.7% conversion rates against the industry average of 1.2%.
Consumer finance advertisers see their strongest results through Google Search Network, with 5.1% conversion rates compared to the sector benchmark of 3.3%.
Healthcare providers achieve 4.2% conversion rates through Facebook Lead Ads, significantly outperforming the industry standard of 2.8%.
6.2 Multi-Channel Synergy Effects
Research from Google’s marketing team shows that coordinated multi-channel campaigns increase conversion rates by 24% on average compared to single-channel efforts. This synergy explains why integrated approaches consistently outperform isolated tactics.
Retargeting sequences demonstrate particularly strong performance. Display advertisement followed by search retargeting increased conversion likelihood by 76% in studied campaigns.
Channel reinforcement similarly drives results, with consumers exposed to both social media and email advertisements becoming 2.1 times more likely to convert than those seeing either channel alone.
Frequency optimization across channels proves equally important. The optimal exposure frequency before diminishing returns is 5 touches across 3 channels for most considered purchases; demonstrating that coordinated precision outperforms sheer volume.
Summary – Channel Selection Strategy:
| Industry | Top-Performing Channel | Average Conversion | Industry Benchmark |
| E-commerce | Instagram Shopping (Mobile) | 3.8% | 2.5% |
| B2B Services | LinkedIn Sponsored Content | 2.7% | 1.2% |
| Consumer Finance | Google Search Network | 5.1% | 3.3% |
| Healthcare | Facebook Lead Ads | 4.2% | 2.8% |
7. Budget Planning and Timeline Development
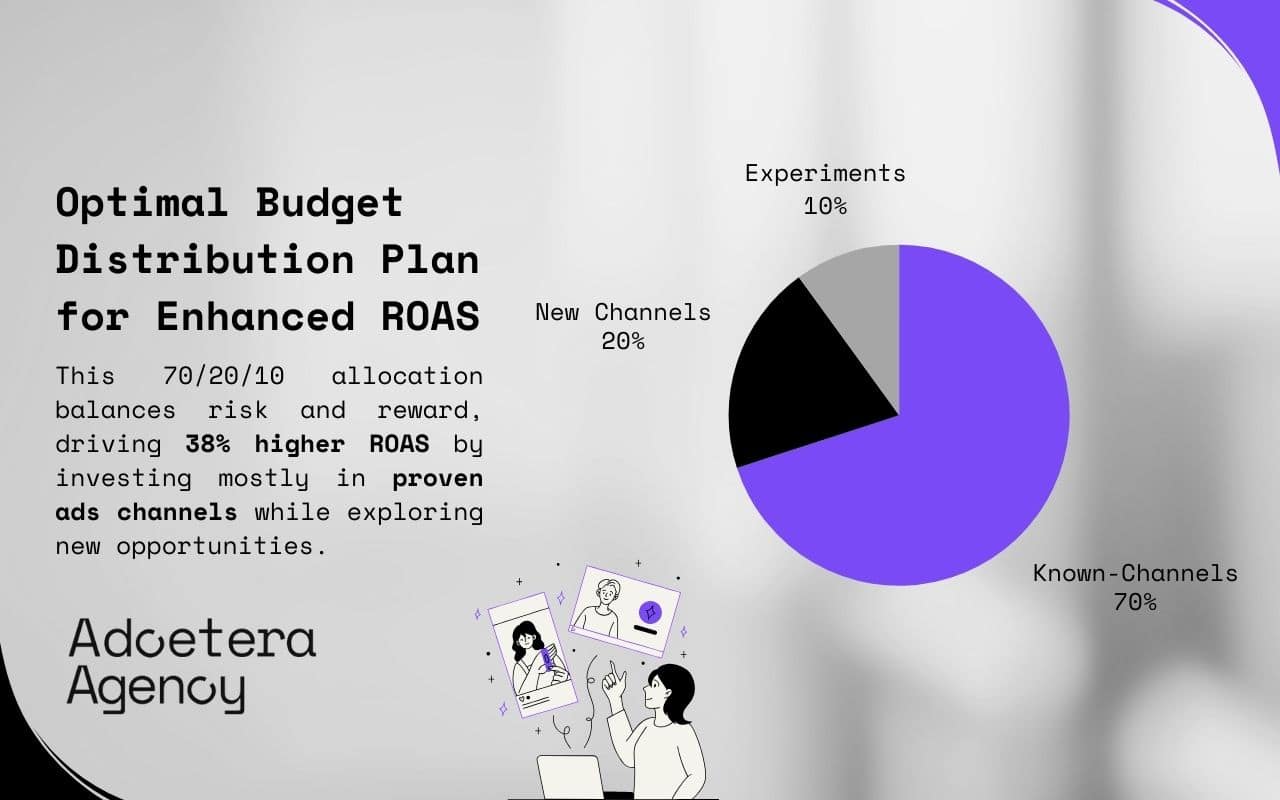
Efficient resource allocation is critical when determining how to make an advertisement campaign successful. Data from Marketing Evolution demonstrates that optimized budget allocation improves ROAS by an average of 38% even without increasing total spending.
7.1 Budget Allocation Frameworks
Top-performing advertisers follow allocation principles that balance certainty with opportunity. The 70/20/10 rule represents one effective approach: allocating 70% to proven channels, 20% to emerging opportunities, and 10% to experimental approaches.
The pulsing versus continuous decision also impacts performance. Pulsed campaigns (high intensity followed by rest periods) outperformed continuous campaigns by 23% in competitive markets; likely by creating greater pattern interruption for viewers.
Day-parting optimization delivers consistent improvements. Focusing the budget on high-conversion time windows improved efficiency by 31% in analyzed campaigns, especially for products with time-sensitive purchase patterns.
7.2 Timeline Considerations That Impact Conversion
Research published in the Journal of Advertising Research confirms several timing effects with significant conversion impact. Seasonal sensitivity represents one key factor, with conversion rates fluctuating by up to 42% based on seasonal relevance.
Competitive timing strategies also deliver advantages. Advertisements launching 1-2 weeks before major competitor campaigns saw 18% higher conversion rates by establishing mental positioning before competitive noise increased.
Message evolution over time similarly drives performance. Campaigns that evolved messaging throughout their duration outperformed static campaigns by 37% for purchases with consideration periods longer than 14 days; demonstrating why sophisticated campaigns adjust their approach as audiences move through the purchase funnel.
Summary – Budget Planning and Timeline:
| Budget Strategy | Performance Improvement | Application Example |
| 70/20/10 Rule | +38% ROAS | Optimal allocation across proven, emerging, and experimental channels |
| Pulsed vs. Continuous | +23% | Higher performance in competitive markets with intensity variation |
| Day-Parting Optimization | +31% | Efficiency improvement focusing on high-conversion time windows |
| Seasonal Sensitivity | +42% fluctuation | Conversion rate variation based on seasonal relevance |
8. A/B Testing and Optimization
Continuous optimization dramatically impacts how to make an advertisement more effective over time. According to Optimizely, companies implementing systematic A/B testing see an average 14.6% annual increase in conversion rates; a compound improvement that delivers significant long-term advantages.
8.1 Elements Worth Testing (Ranked by Impact)
Meta-analysis of over 1,000 advertising tests revealed that value proposition variations produced the highest conversion improvements, averaging a 40% lift in successful tests. CTA wording and design changes delivered the second-highest impact at 27% average improvement.
Visual focal point adjustments generated 22% conversion increases, while headline reformulations yielded 18% better performance. Social proof element variations rounded out the top five, resulting in 15% higher conversion rates when optimized effectively.
8.2 Testing Methodology for Statistical Significance
To avoid false positives, high-performing advertisers follow rigorous testing protocols that ensure reliable results. Minimum sample size calculations based on current conversion rates provide the foundation; for a 3% baseline rate, approximately 25,000 impressions per variation ensures statistical validity.
Test duration also impacts reliability. Running tests for complete business cycles (minimum 7 days, ideally 14+ days) accounts for day-of-week effects that might otherwise skew results. Segment analysis provides additional insights, breaking down results by key audience segments to identify targeted optimizations. This approach has revealed that 42% of seemingly “failed” tests actually contain successful segments worthy of further development.
One retail advertiser implementing systematic A/B testing across their campaign portfolio improved overall conversion rates from 2.1% to 3.8% over 6 months, representing an 81% increase in performance.
This dramatic improvement demonstrates the cumulative power of systematic testing in driving advertising effectiveness.
Summary – A/B Testing Elements:
| Test Element | Average Improvement | Sample Size Requirement |
| Value Proposition Variations | +40% | Highest impact element in meta-analysis of 1,000+ tests |
| CTA Wording and Design | +27% | Second highest conversion improvement element |
| Visual Focal Points | +22% | Significant impact through attention direction |
| Headline Formulations | +18% | Moderate but reliable conversion improvement |
| Social Proof Elements | +15% | Consistent lift through credibility enhancement |
9. Tracking Performance Metrics
Proper measurement is essential when determining how to make an advertisement campaign successful. According to the Data & Marketing Association, advertisers using comprehensive tracking frameworks achieve 23% higher ROI than those using basic metrics alone.
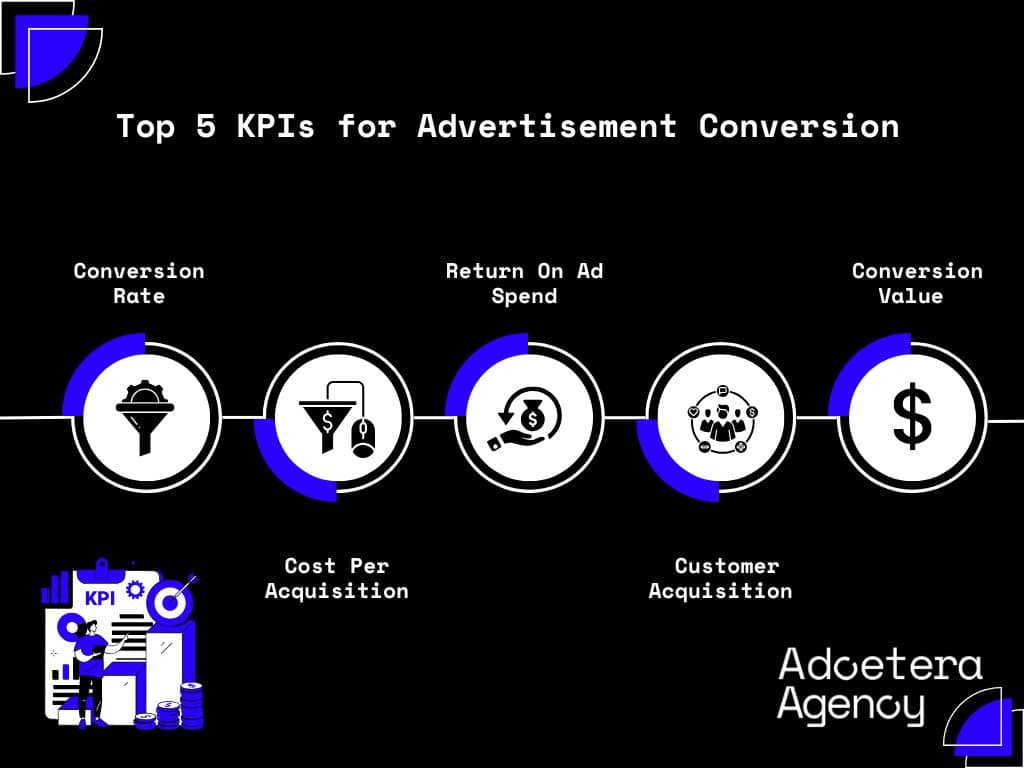
9.1 Essential KPIs for Conversion-Focused Advertising
Conversion rate (the percentage of ad viewers who complete your desired action) provides the most direct measure of effectiveness. While industry averages hover around 3.2%, high-performance campaigns consistently achieve 5.7% or better.
Cost per acquisition tracks efficiency by dividing total ad spend by conversion count. The average sits around $56.11, while top performers achieve $33.84 or lower; a significant competitive advantage.
Return on ad spend (ROAS) measures revenue generated per dollar of advertising investment. Industry average performance reaches 287%, while high-performers achieve 420% or better. The customer acquisition cost ratio compares lifetime value to acquisition cost, with 3:1 representing the industry standard and 5:1 or better indicating exceptional performance.
Assisted conversion value measures revenue from conversions where your advertisement appeared in the path but wasn’t the final converting touch. This typically accounts for 35% or more of the total conversion value in sophisticated campaigns.
9.2 Attribution Modeling for Accurate Measurement
Research from Google Analytics shows that advanced attribution models provide 17% more accurate conversion data than last-click attribution. Position-based attribution gives 40% credit to first interaction, 40% to last, and 20% distributed across middle touchpoints; creating a more realistic view of influence throughout the purchase journey.
Data-driven attribution takes this further by algorithmically assigning credit based on statistical analysis of conversion paths. This approach improved ROAS by 33% in studied campaigns by more accurately valuing each touchpoint’s contribution.
Time-decay attribution weighs touchpoints closer to conversion more heavily, accounting for recency bias in decision-making. This approach proves especially effective for products with longer consideration periods where initial touchpoints have diminishing influence over time.
Summary – Performance Metrics:
| Key Performance Indicator | Industry Average | High-Performance Benchmark |
| Conversion Rate | 3.2% | 5.7%+ |
| Cost Per Acquisition | $56.11 | $33.84 or less |
| Return On Ad Spend | 287% | 420%+ |
| Customer Acquisition Cost Ratio | 3:1 | 5:1+ |
| Advanced Attribution Models | – | +17% more accurate data than last-click |
10. Case Studies: Advertisements That Converted
Examining successful examples provides valuable insights into how to make an advertisement that drives measurable results across different contexts.
10.1 Case Study 1: E-commerce Product Launch
A direct-to-consumer brand launching a new skincare line implemented targeted strategies that delivered exceptional results. They created hyper-targeted segments based on past purchase behavior and skin concern indicators, ensuring high relevance for each viewer.
Their creative approach centered on side-by-side comparison advertisements showing before/after results with specific timeframes, creating concrete expectation setting. And their testing framework evaluated 8 value proposition variants across 3 audience segments to identify optimal messaging combinations.
These efforts yielded remarkable results: 4.7% conversion rate (129% above industry average), $31.14 CPA (44% below initial target), and 6.2x ROAS. This performance demonstrates how audience-centered approaches consistently outperform product-centered messaging.
10.2 Case Study 2: B2B Service Provider
A SaaS platform offering project management tools took a different approach focused on competitive differentiation. They directly addressed pain points with leading competitor solutions, positioning themselves as the solution to established frustrations.
Their social proof strategy featured case studies showing quantifiable productivity improvements, creating concrete outcome expectations. And their channel approach implemented LinkedIn lead form ads with progressive profiling to reduce friction in the conversion process.
These strategies delivered impressive results: 7.3% form completion rate (305% above B2B benchmark), 32% of leads converting to sales calls, and 41% reduction in cost per qualified lead. This performance illustrates how addressing specific pain points and reducing conversion friction drives B2B advertising success.
Summary – Case Study Results:
| Case Study | Key Strategy | Results | Industry Comparison |
| E-commerce Product Launch | Hyper-targeted segments with before/after visuals | 4.7% conversion rate, $31.14 CPA, 6.2x ROAS | 129% above industry average |
| B2B Service Provider | Competitor differentiation with progressive profiling | 7.3% form completion, 32% to sales calls, 41% lower CPL | 305% above B2B benchmark |
Conclusion: The Science and Art of Creating Advertisements That Convert
Successfully figuring out how to make an advertisement that converts requires both analytical rigor and creative excellence. The data conclusively shows that advertisements built on audience insights, clear objectives, competitive differentiation, compelling messaging, optimized visuals, strategic channel selection, efficient budgeting, continuous testing, and comprehensive measurement consistently outperform those lacking this structured approach.
By implementing the strategies outlined in this guide, businesses typically see 25-40% improvement in conversion rates, 15-30% reduction in customer acquisition costs, and 30-50% increase in return on ad spend. These improvements compound over time, creating sustainable competitive advantages.

Ready to transform your advertising performance but not sure where to start? Adcetera specializes in creating high-converting advertisements for small and medium-sized businesses.
Take the first step today: Try our 2-week free trial and see real results before committing. Our comprehensive services include ad design, performance tracking, A/B testing, retargeting, and competitor analysis to maximize your ROI.
Contact us today to discover how our data-driven approach can help your business grow through advertisements that don’t just get noticed: they convert.
